


Data Analysis
Importance-Performance Analysis
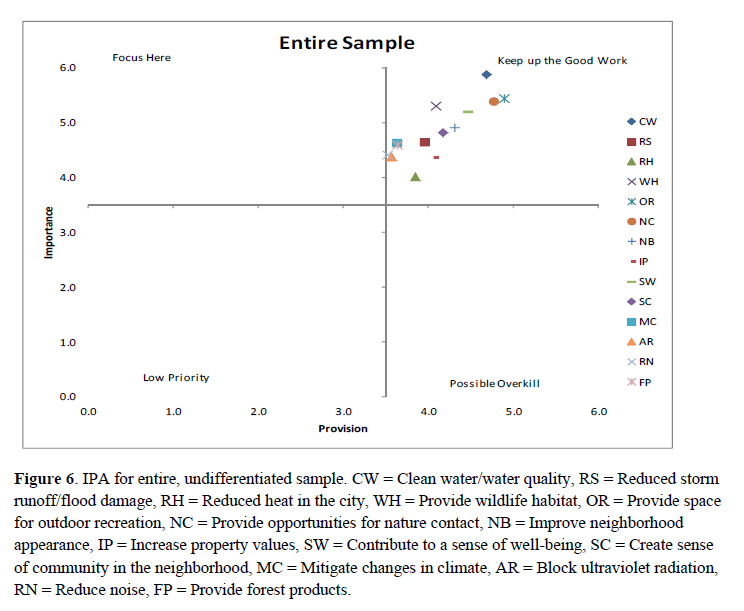
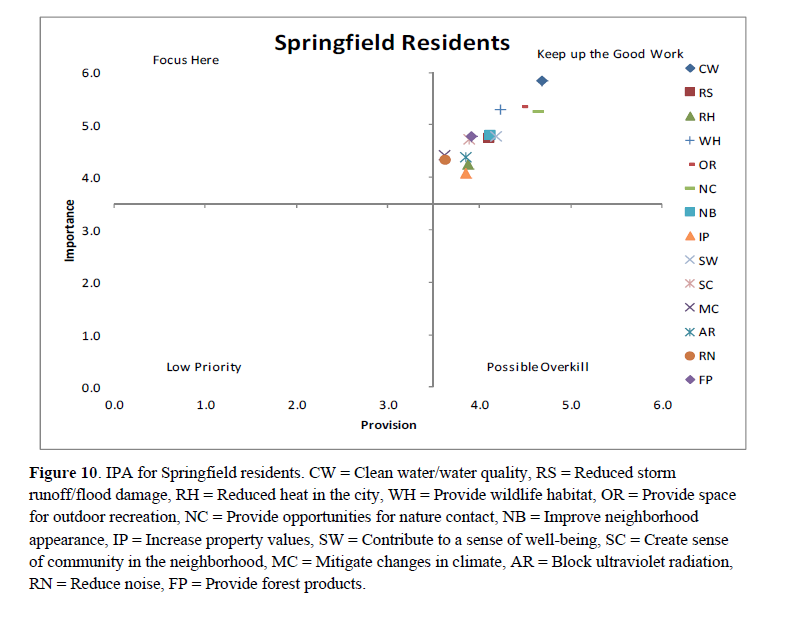
A simple graphical comparison of service importance with how well respondents believe the service is being provided is called importance-performance analysis (IPA). This form of visual analysis produces four quadrants on an x-y axis, based upon responses. If a service falls in the first quadrant ("Focus Here"), it suggests that respondents feel the service is highly important, but not being adequately provided. The "Keep up the Good Work" quadrant (quadrant 2) suggests that the service is important, and being adequately provided. Quadrant 3 ("Possible Overkill") indicates services that are not highly valued, but are being adequately provided. Finally, quadrant 4, "Low Priority," indicates services that are neither highly valued nor well provided.
For this project, we asked respondents how important the following ecosystem services were to them:
- Clean water/water quality (CW)
- Reduced storm runoff/flood damage (RS)
- Reduced heat in the city (RH)
- Mitigate changes in climate (MC)
- Block ultraviolet radiation (AR)
- Reduce noise (RN)
- Provide wildlife habitat (WH)
- Provide space for outdoor recreation (OR)
- Provide opportunities for nature contact (NC)
- Provide forest products (FP)
- Improve neighborhood appearance (NB)
- Increase property values (IP)
- Contribute to a sense of well-being (SW)
- Create sense of community in the neighborhood (SC)
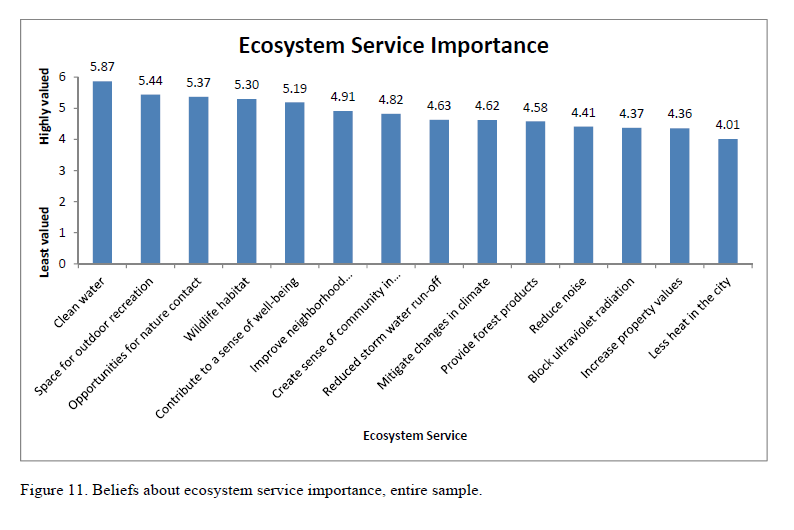
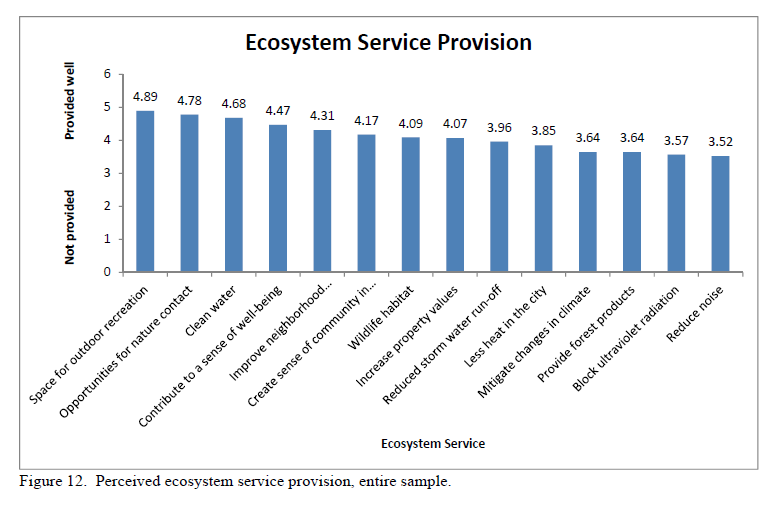
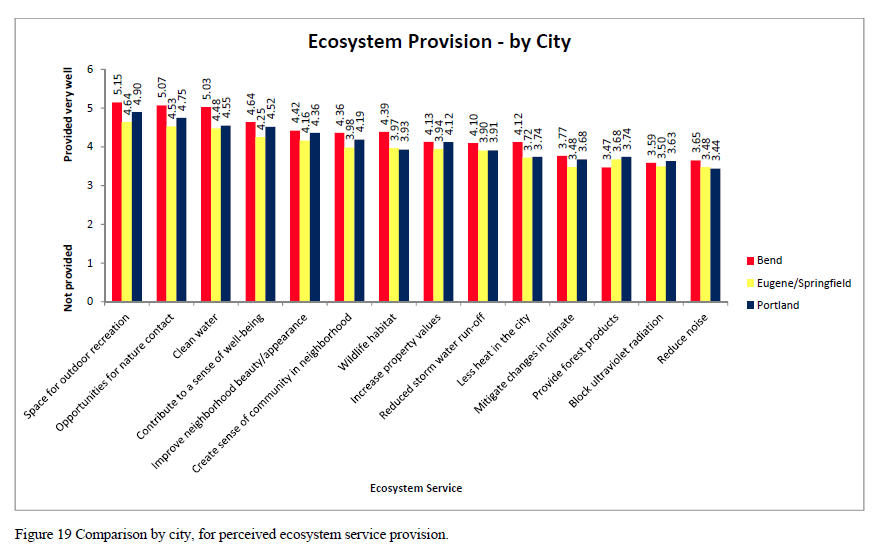
We also asked how well their city was providing the services listed above. The response scale for the ecosystem service importance questions ranged from 0 ("Least valued") to 6 ("Highly valued"). The scale for provision of services ranged from 0 ("Not provided at all") to 6 ("Provided extremely well"). Please note that mitigate climate change (MC), block ultra violet radiation (AR), reduce noise (RN), and forest products (FP) are grouped together at the bottom of each graph legend because they were routinely services that received the lowest provision scores. There is a complication with interpretation of respondents' attitudes about provision of climate change, ultra violet radiation, and forest products. Questions pertaining to provision of these services had a fairly high degree of non-response (combined blanks and "Don't know' replies): Mitigate climate change - 32% non-response; block ultra violet radiation - 38% non- response; forest products - 28% non-response. We interpret non response in these categories of services as an indication that respondents likely did not understand what we were asking. For example, with respect to the importance of mitigating climate change effects, the 98% response rate suggests respondents felt knowledgeable enough to express their opinion about its importance. The 68% response on its provision, however, suggests that respondents either did not understand how urban forests help mitigate climate change effects, or did not understand the question. Therefore, the low provision scores in these categories of services may not accurately reflect public attitudes and should be considered with caution.
We slightly modified the IPA matrices to reflect a higher standard of service provision. While it is customary to intersect the matrix axes at each midpoint, we intersected them slight above the midpoint of each scale (3.5 instead of 3.0). As will be observed, had the midpoint of 3.0 been selected, all the services would have fallen comfortably in the "Keep up the Good Work" quadrant. All data were weighted by age, ethnicity, and gender, using 2010 U.S. Census data. The results we present below are only for the cities in our study. We focused only on cities for IPA two reasons. First, IPA results must be reviewed with some caution, as we discuss above and in the Methods section. Therefore, use beyond a "snapshot" looking at individual cities was deemed as potentially problematic. Secondly, IPA figures are not helpful when comparing different groups. Therefore, the group comparisons (females and males, homeowners and renters, and among the cities) are presented as histograms and tables showing any differences and significance of those differences.
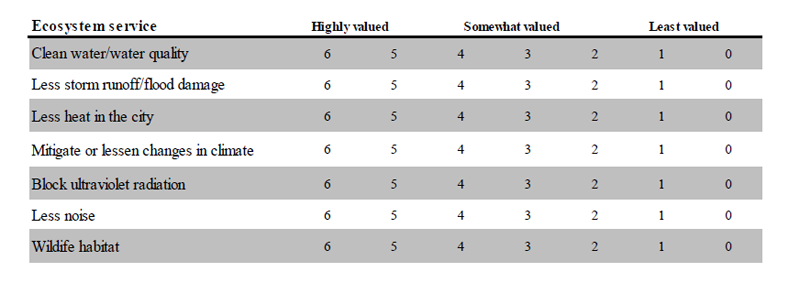
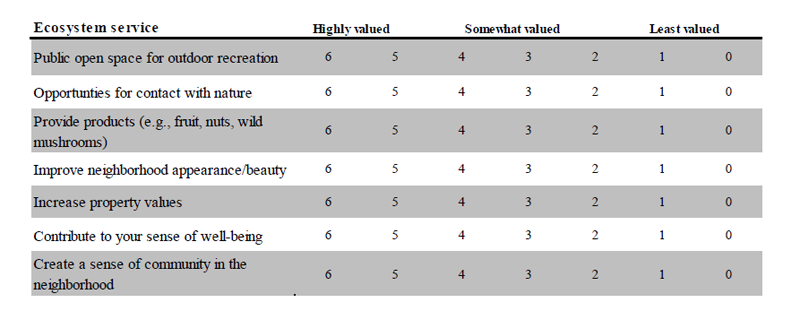
We presented the following set of questions to respondents to assess the level of importance and provision of ecosystem services provided by urban forests:
In the following question, we would like to get a better idea of how important different ecosystem services are to you in general.
Directions: Please rate how valuable you feel each ecosystem service is by circling one number on the scale, from 6 (Highly valued) to 0 (Least valued).
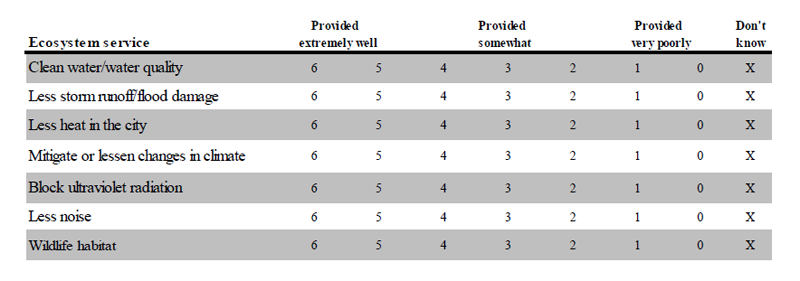
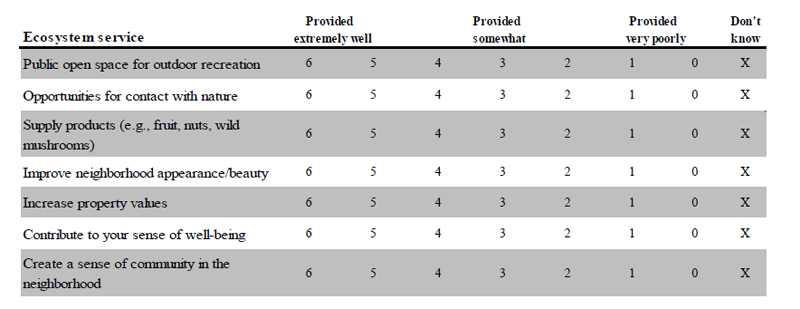
Now we would like to learn your opinion about how well you think urban forests in your city are currently providing different ecosystem services.
Directions: Please rate how well you feel urban forests in your city are currently providing the service by circling one number on the scale from 6 (Provided extremely well) to 0 (Provided very poorly). If you do not know whether urban forests in your city are providing the service, circle the X.
The following figures portray the outcomes for importance-performance for the cities included in the study.
This figure shows the outcome for entire, combined sample.
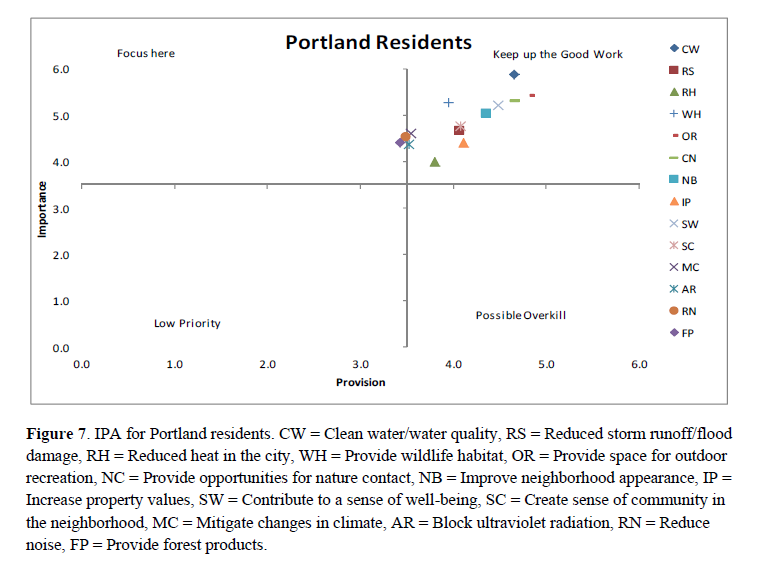
This figure shows the outcome for Portland residents only.
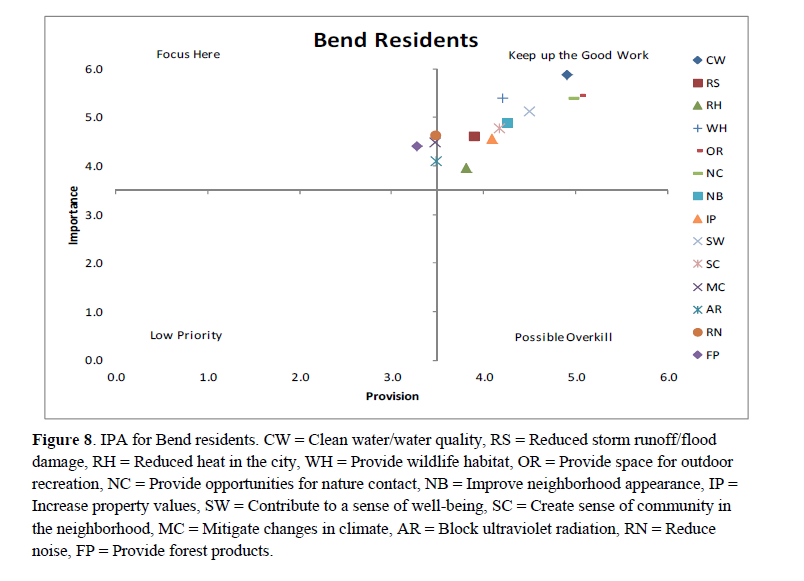
This figure shows the outcome for Bend residents only.
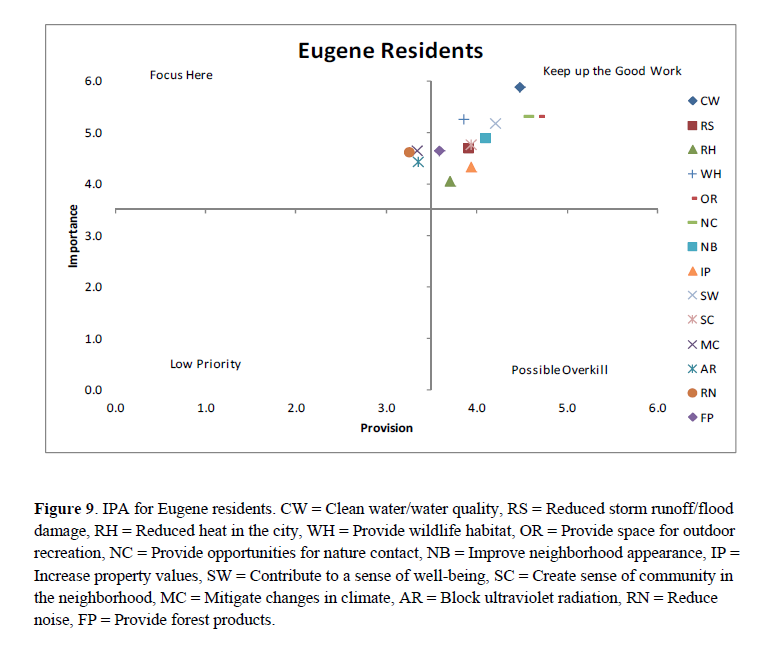
This figure shows the outcome for Eugene residents only.
The figure shows the outcome for Springfield residents only
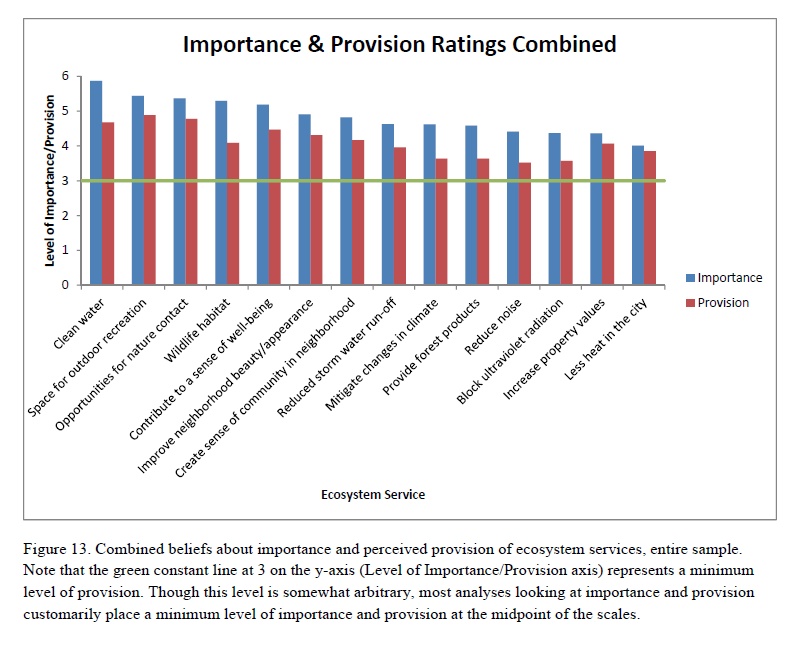
The following figures present the same results as the IPA figures for the importance and provision of ecosystem services for the entire sample. These figures provide a more detailed picture of relative importance of each ecosystem service included in our study, and the relative provision of each service. Following Figures 9, 10, and 11, figures and tables show comparisons between males and females, homeowners and renters, and among the cities.
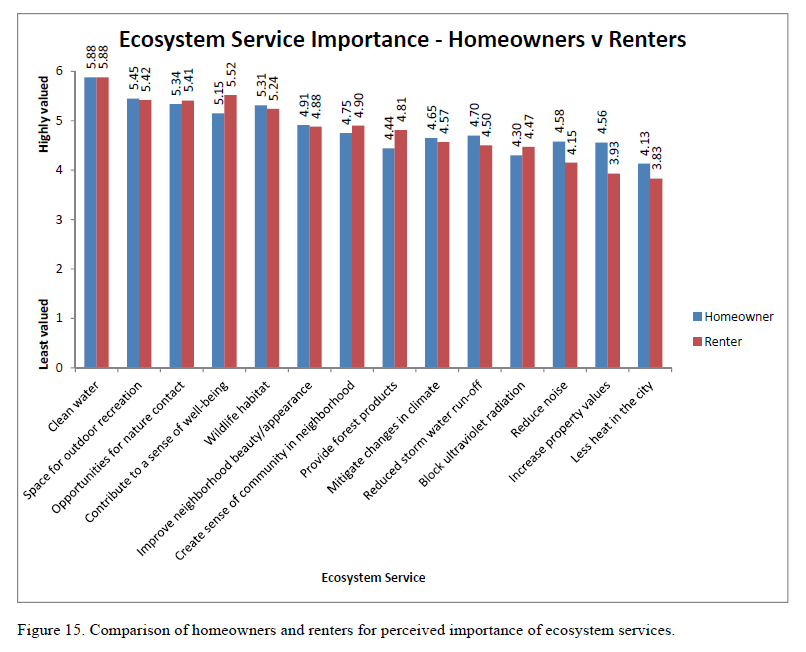
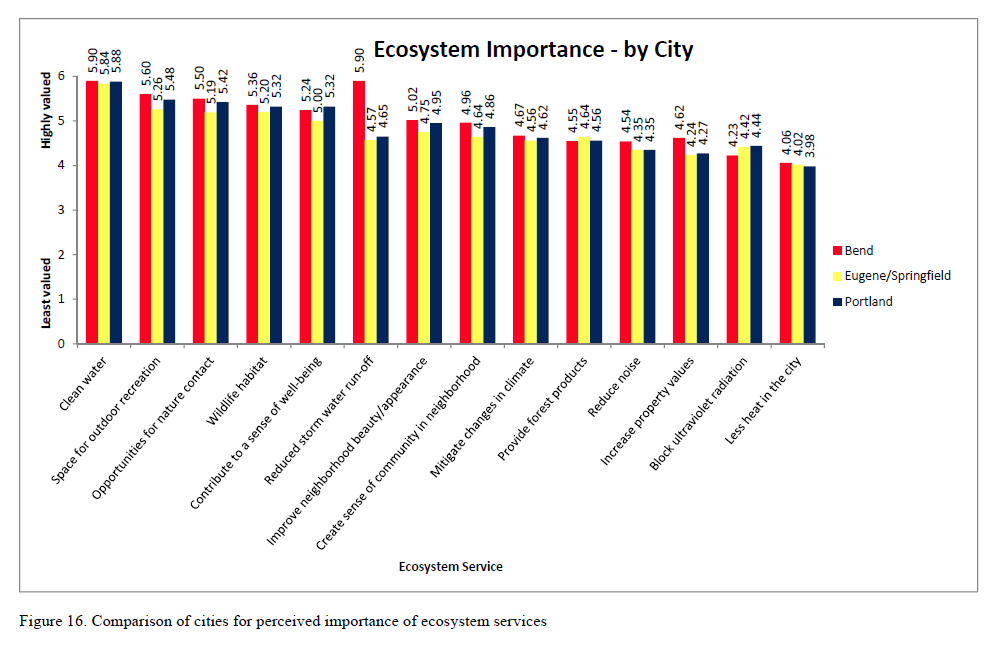
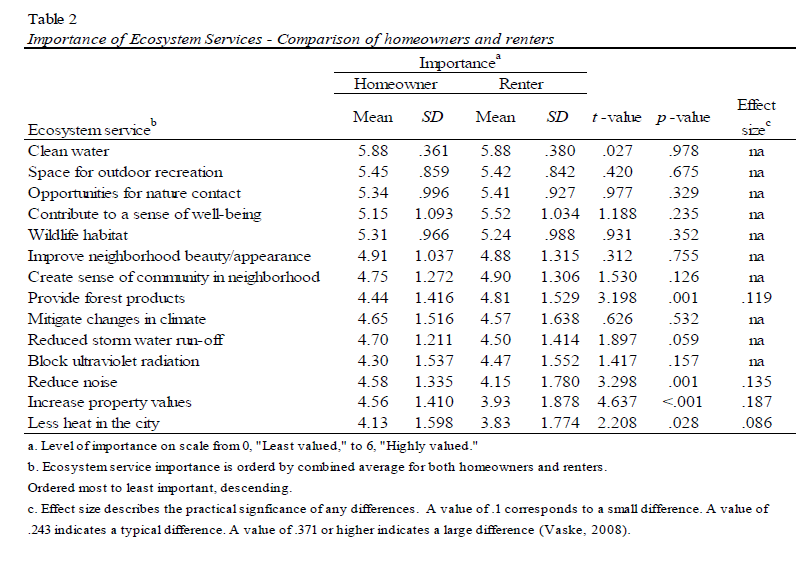
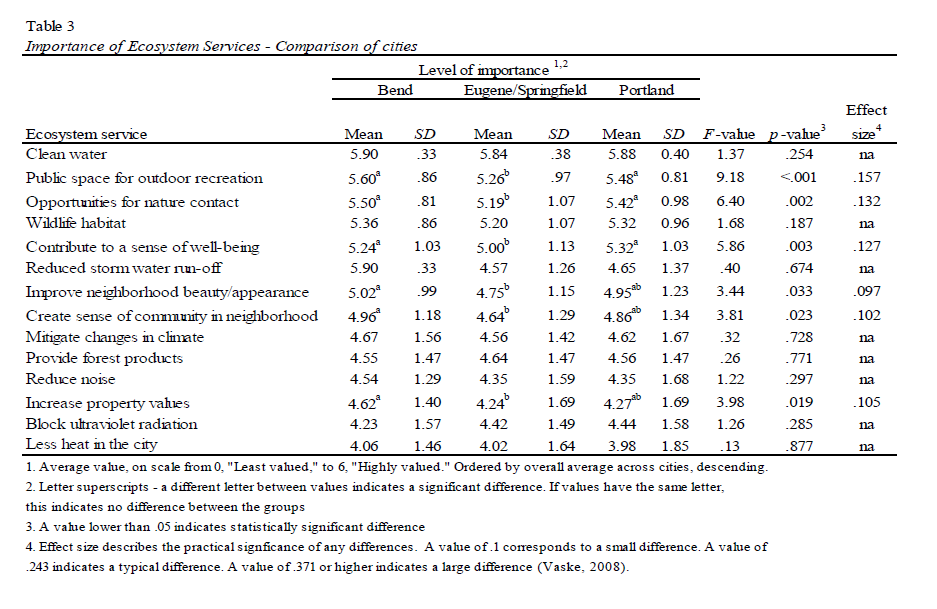
The following figures present comparisons between females and males, homeowners and renters, and among the cities for beliefs about the importance of different ecosystem services.
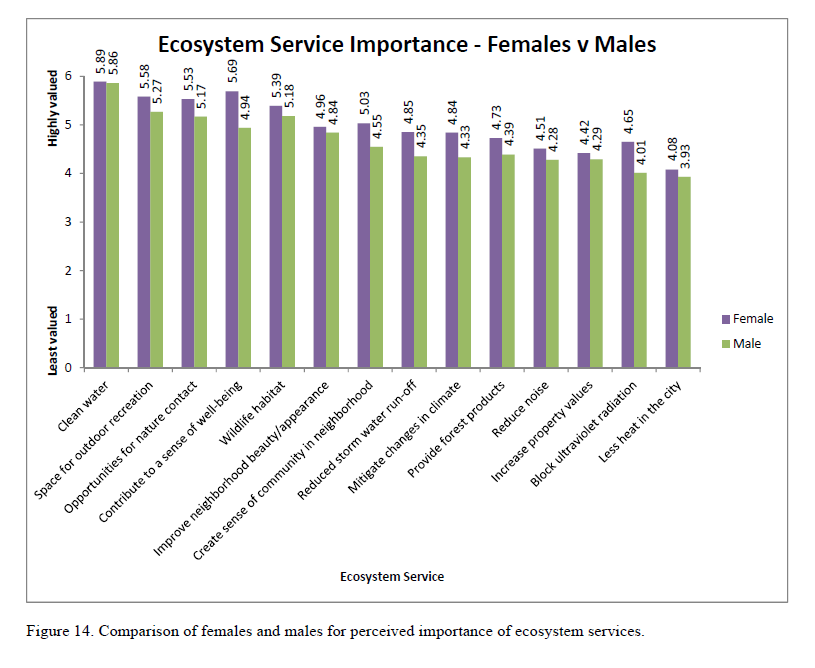
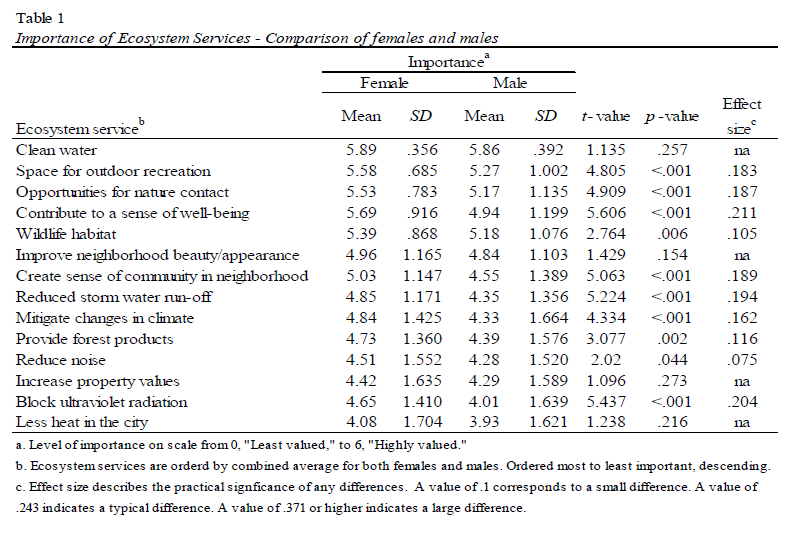
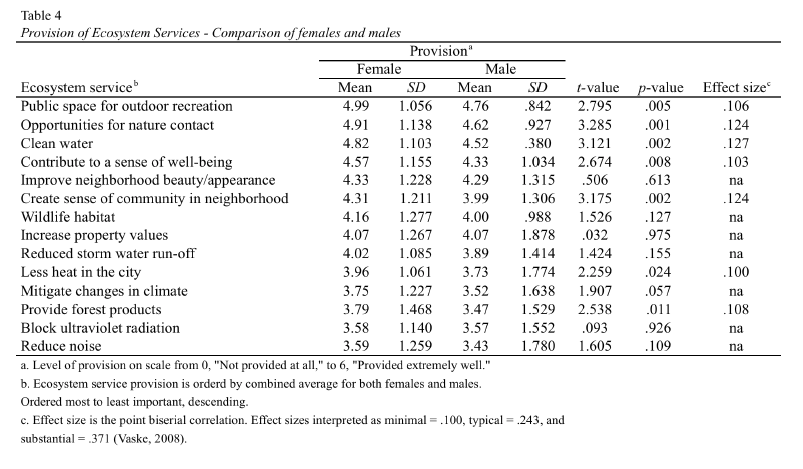
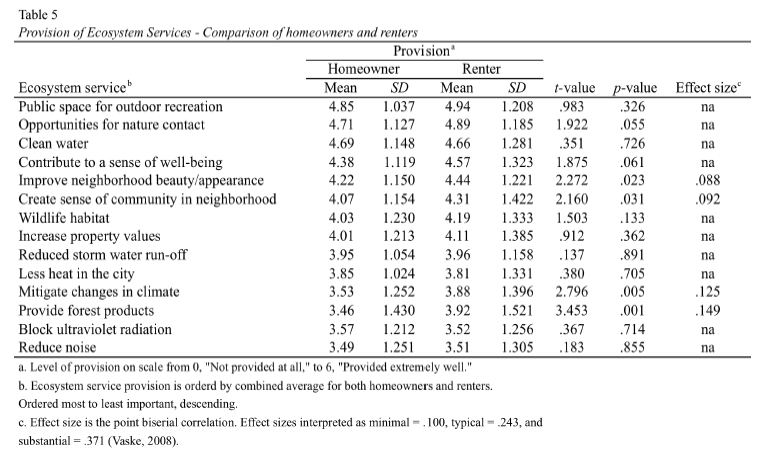
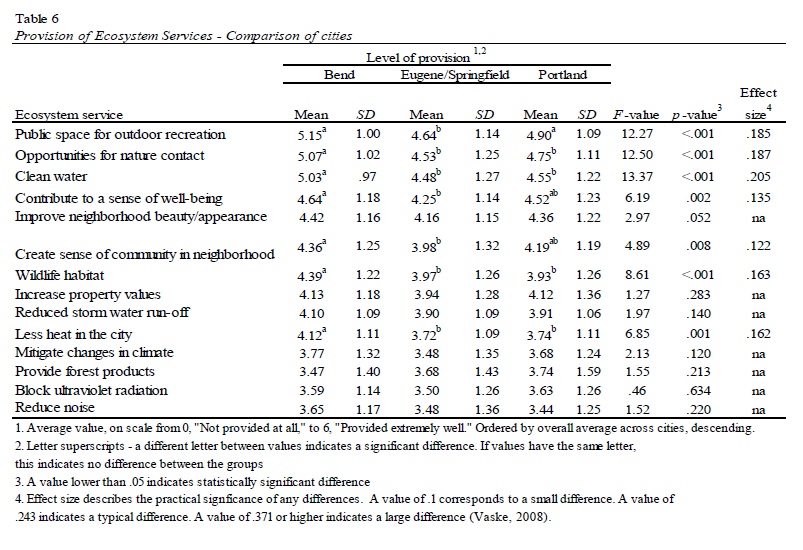
The following tables show the statistical comparisons between groups. These tables indicate where statistically significant differences occur, and whether those differences could be considered minimal, typical, or substantial. According to Vaske (2008), the differences, or effect sizes, indicate whether there is a relationship among variables that has practical significance. A "small" or "minimal" effect size indicates that while the relationship between the variables is statistically significant, it is nonetheless minor or of relatively small consequence. A "typical" relationship, or typical effect size, indicates a relationship that one would expect to find in most behavioral science studies. That is, it is typical of the kinds of relationships that are commonly found in this type of research. Finally, a substantial or large effect size should indicate to researchers and practitioners that the association between the variables is the result of a considerable difference and the relationship is noteworthy.
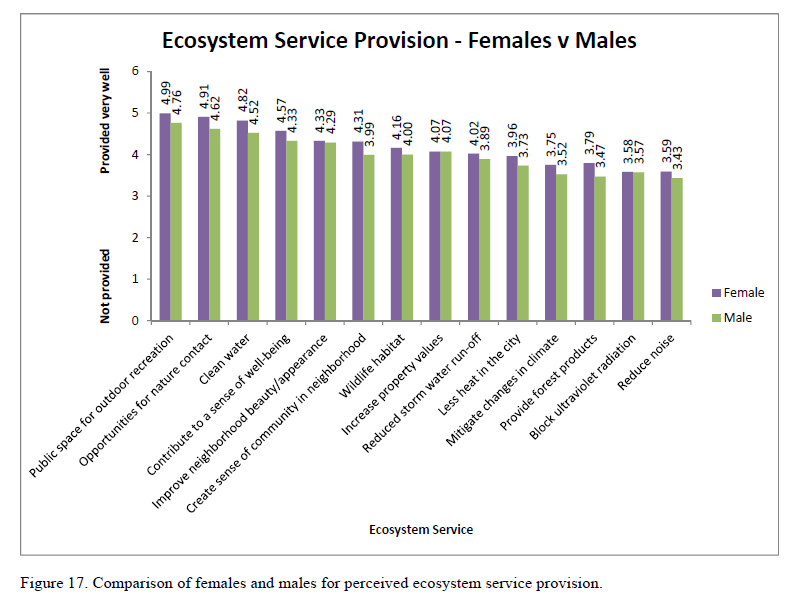
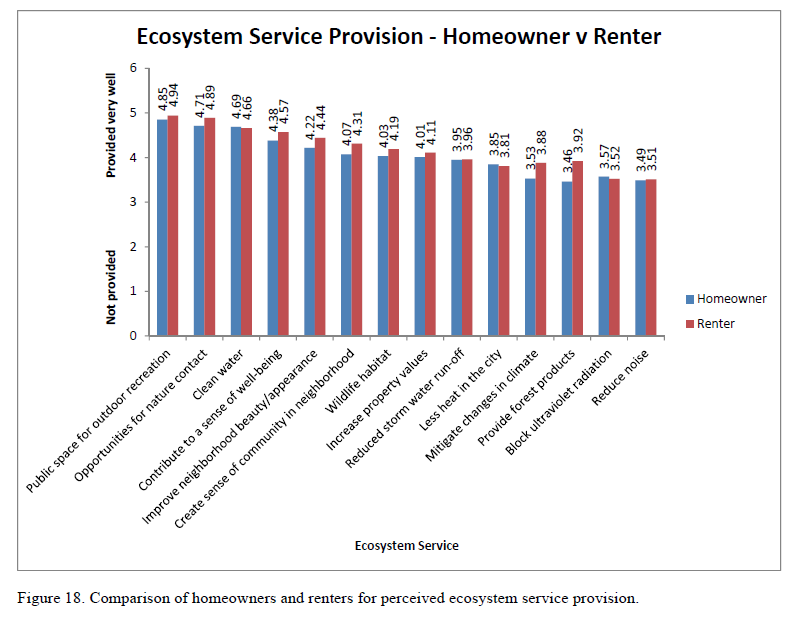
The following figures show comparisons of females and males, homeowners and renters, and among the cities for perceived provision of ecosystem services. These figures are followed by tables that show comparisons for each group, showing areas of significant difference and the practical implications of the difference (i.e. minimal, typical, or substantial differences).
In the following sections, we present outcomes and analyses of the different conceptual areas contained within the survey. The conceptual areas are: beliefs about the problems associated with urban trees and forests; perceived threats to urban forests; opinions about important management goals; preferences for obtaining information about natural resource issues; indicators of successful urban forest management, trust in different information sources; attitudes about who is qualified to manage urban natural resources; attitudes about who has influence in natural resource decisions; and finally a section on level of familiarity with urban forest and ecosystem terminology (measured as familiarity with the terms). Basic demographic information of respondents can be located at the end of this section.