


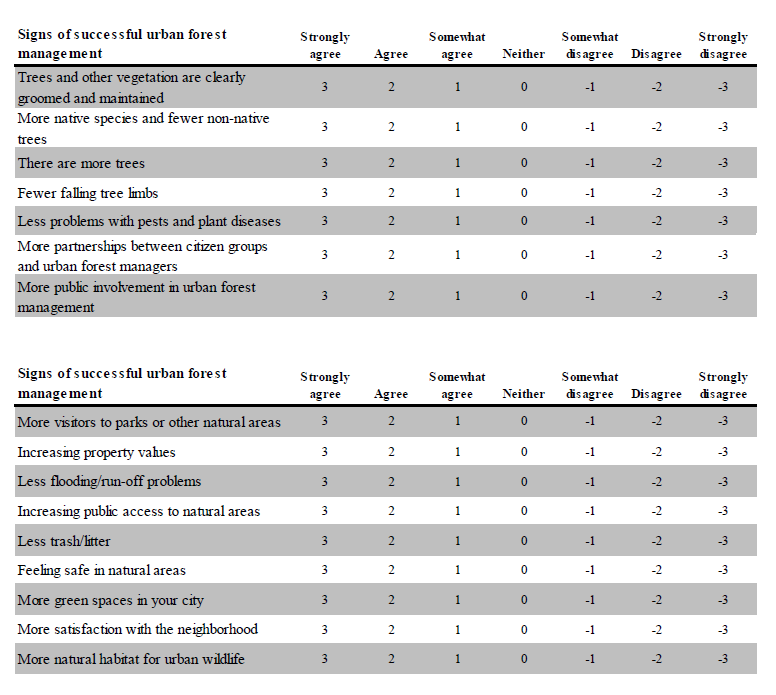
The following figures and tables depict our sample's responses to a question about what they believed signs of successful urban forest management in their city were. The scale for responses for this question is different than previous scales shown. This scale was based on level of agreement, and had values of 3 ("Strongly agree"), 2 ("Agree"), 1 ("Somewhat agree"), 0 ("Neither agree nor disagree"), -1 ("Somewhat disagree"), -2 ("Disagree"), to -3 ("Strongly disagree"). Therefore, the means are lower than the previous scales because negative values for disagreement were used in mean response calculations and the maximum value is 3.The following set of questions was presented to respondents:
We would like to learn more about what you believe are signs of successful urban forest management in your city.
Directions: Please indicate your level of agreement with each item, by circling one number on the scale from +3(Strongly agree) to -3 (Strongly disagree).
Note: Response choices have changed to "Agree - Disagree."
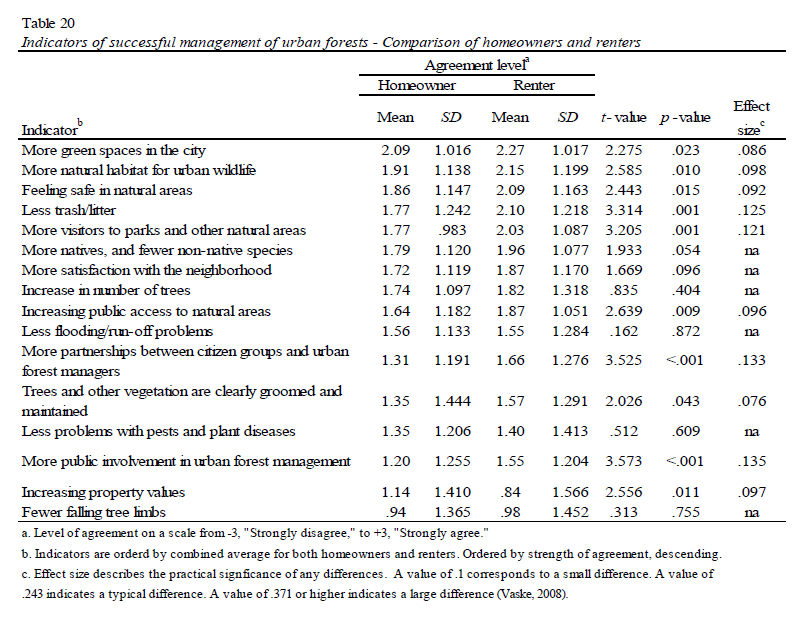
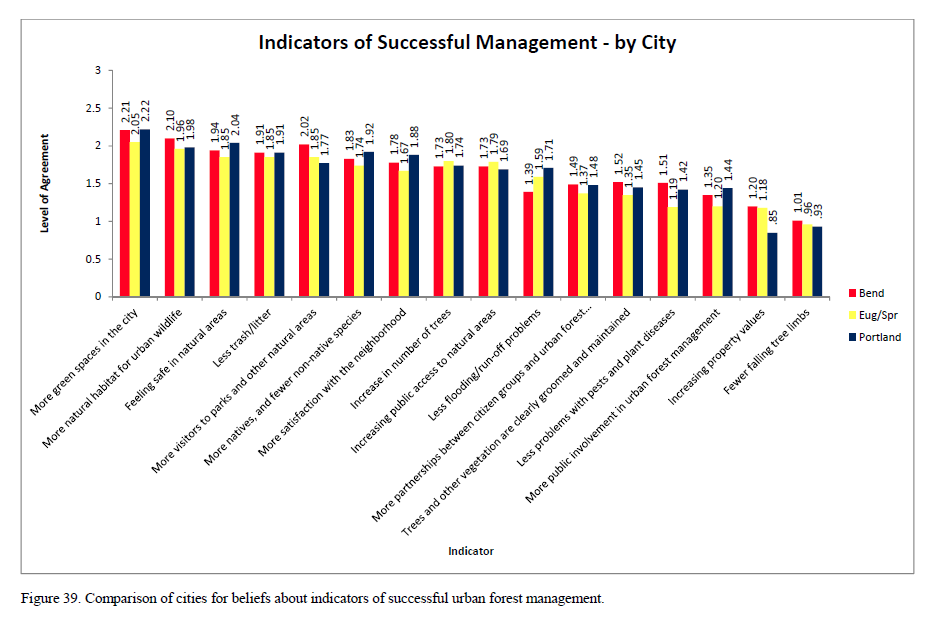
The following figures display the results for the entire sample, comparisons between females and males, homeowners and renters, and across the three city areas for indicators of successful management. The order (highest to lowest) in which the information sources appear is based upon the average of the scores across the groups for each problem item.


The following tables show the statistical comparisons between groups. These tables show where statistically significant differences occur, and whether those differences could be considered minimal, typical, or substantial.