


Data Analysis
Preferences for Obtaining Information
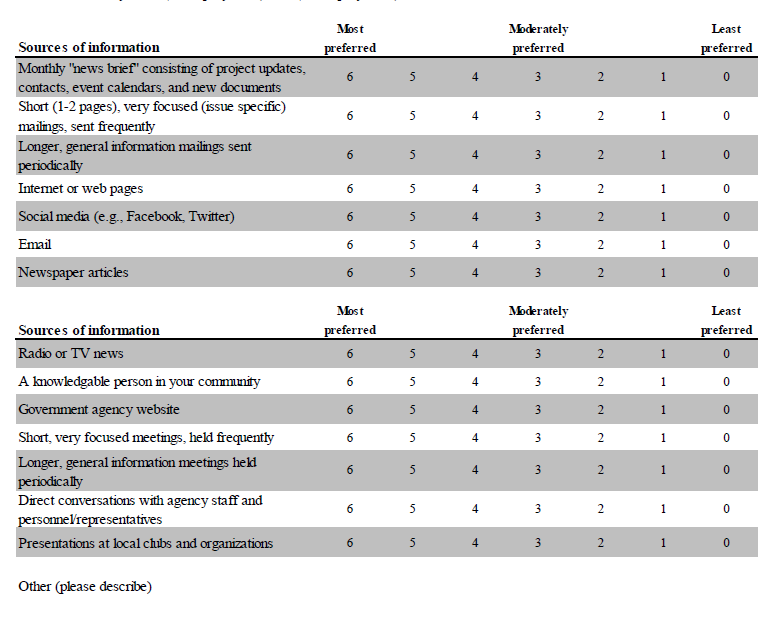
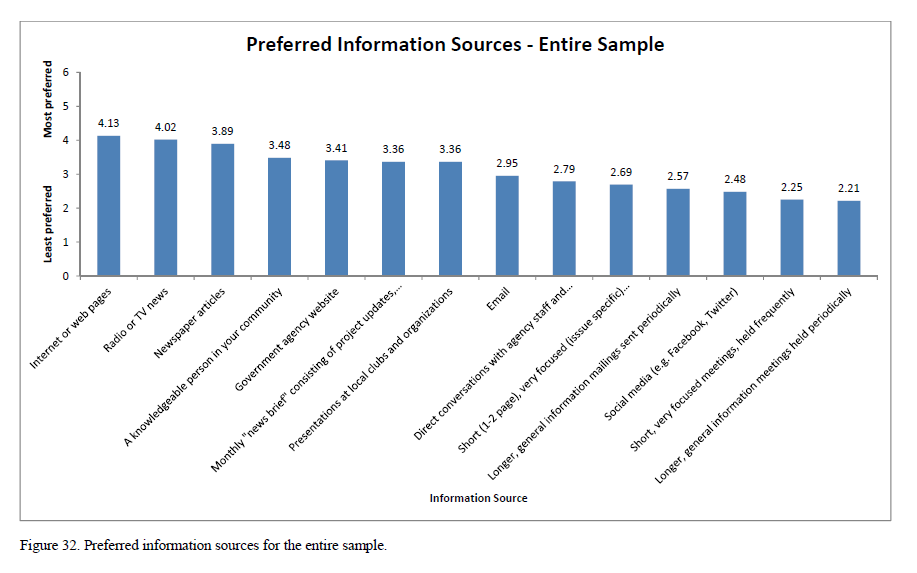
We asked respondents how they prefer to obtain information about urban forests. The response categories for this question ranged from 6 ("Most preferred") to 0 ("Least preferred"). Responses are not strictly ranked, in that respondents could select the same value for more than one information source (i.e., the preferences were not mutually exclusive). The following set of questions was presented to respondents:
We would like to learn more about your preferences for obtaining information about urban forests in your city.
Directions: Please rank your preference for the following information sources by circling one number on the scale from 6 (Most preferred) to 0 (Least preferred).
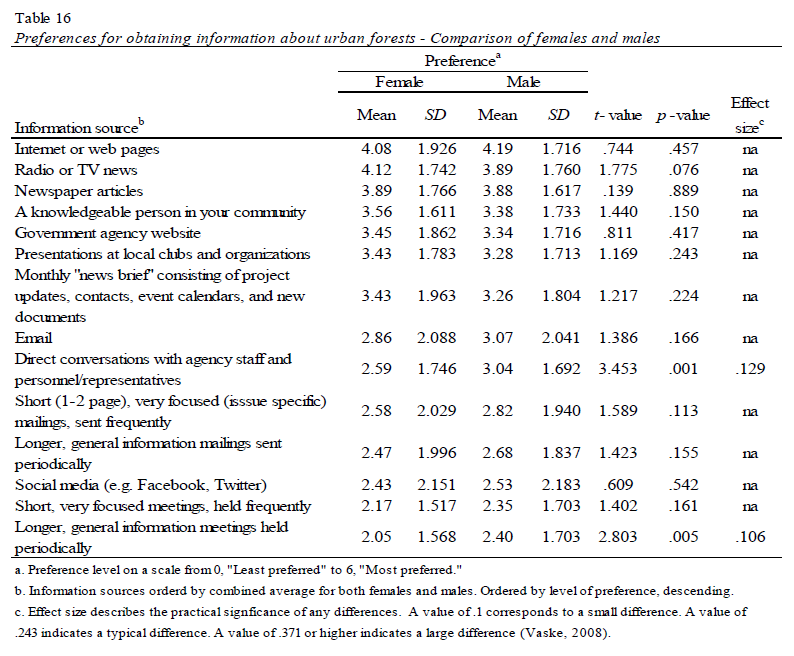
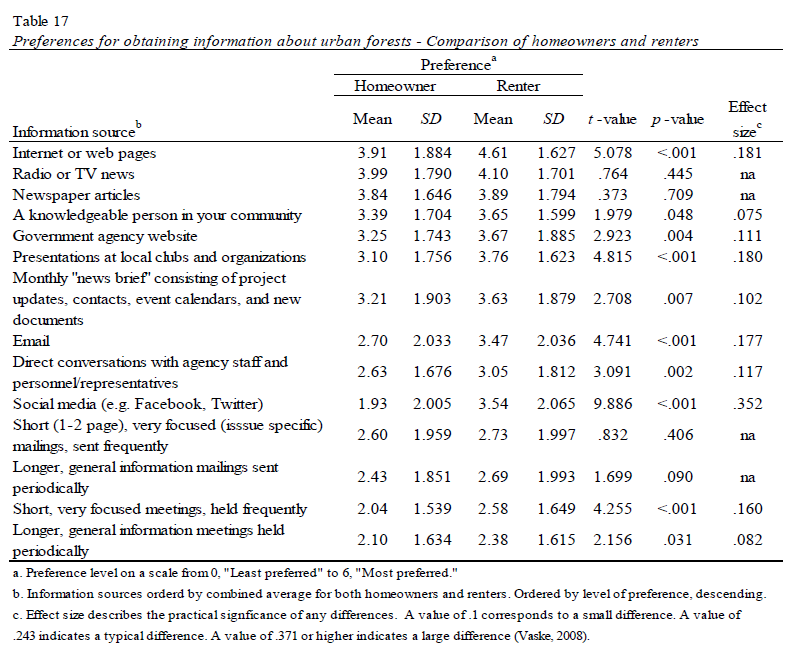
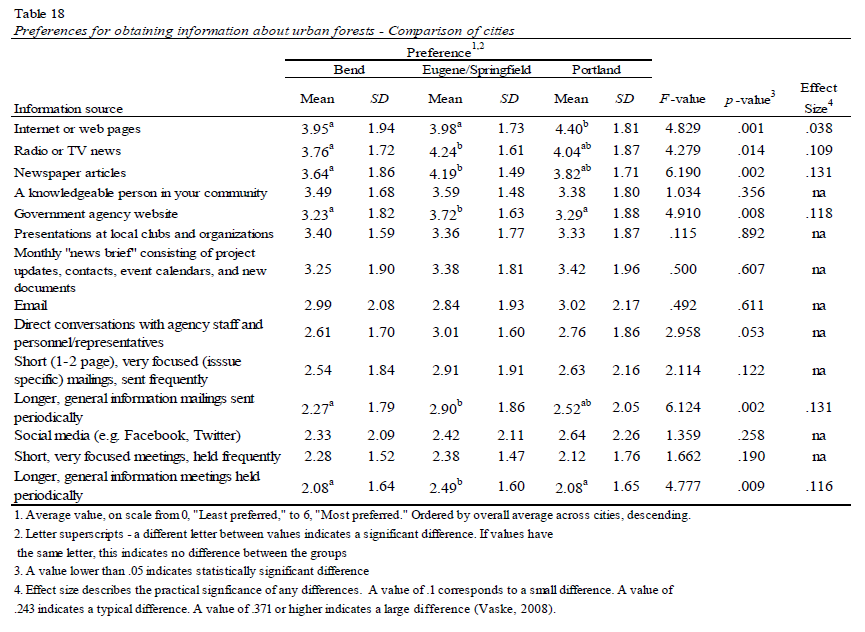
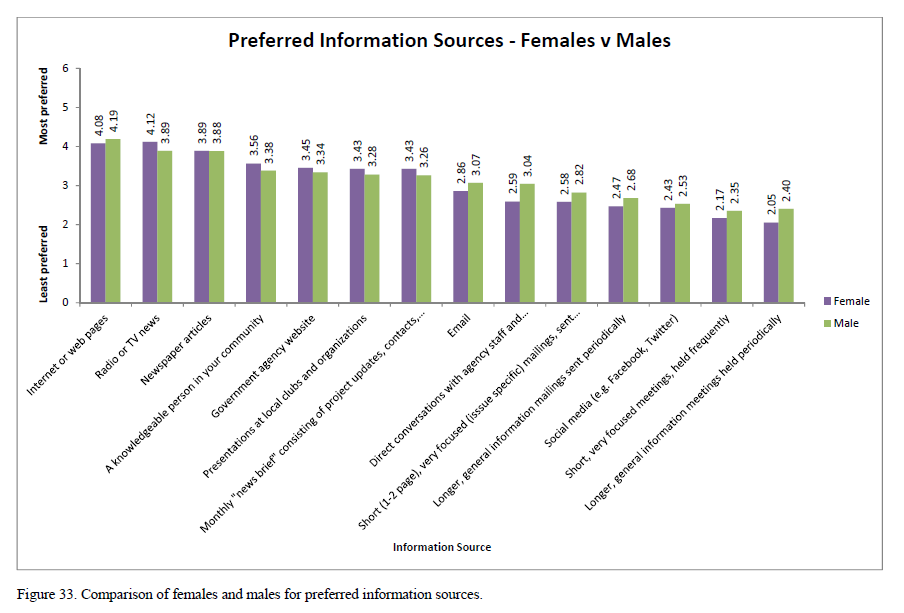
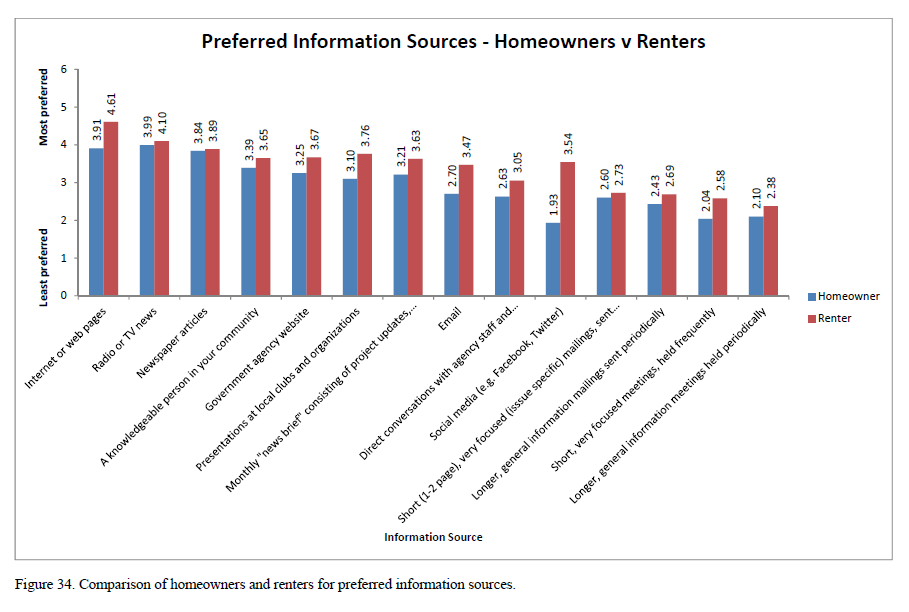
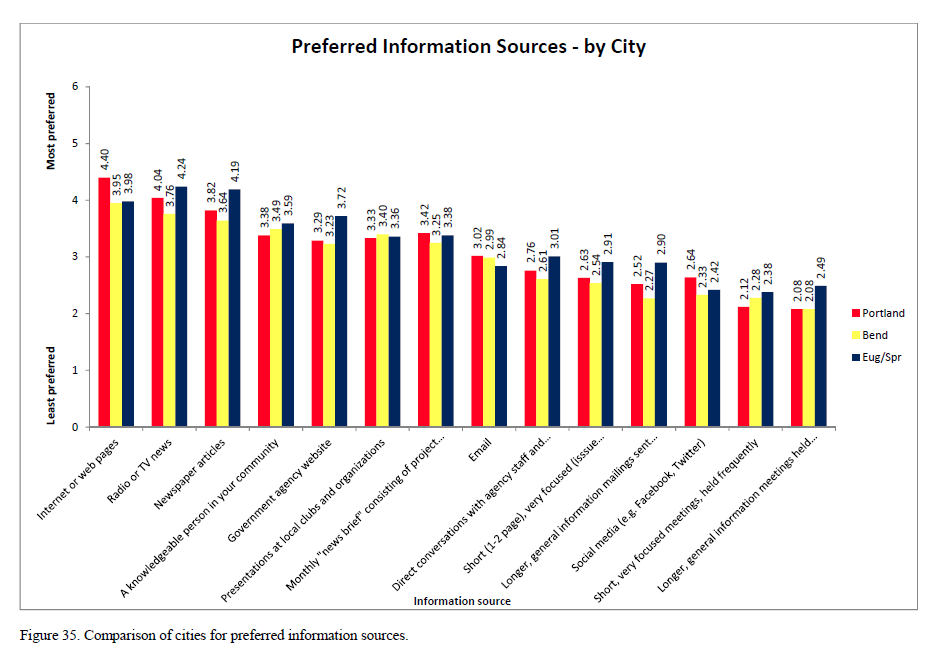
The following figures display the results for the entire sample, comparisons between females and males, homeowners and renters, and across the three city areas for preferred sources of information. The question asked how preferred, on a scale from 6 ("Most preferred") to 0 ("Least preferred"), was each information source. The order (highest to lowest) in which the information sources appear is based upon the average of the scores across the groups for each problem item.
The following tables show the statistical comparisons between groups. These tables show where statistically significant differences occur, and whether those differences could be considered minimal, typical, or substantial.