
| glossary | menu | Normal | lg | hc | 7.) Classification and Channel Geometry Relations > Return Interval & Probability Analysis |
| < Previous | 1 | 2 | 3 | 4 | 5 | 6 | 7 | 8 | 9 | 10 | 11 | 12 | 13 | 14 | 15 | 16 | 17 | 18 | 19 | 20 | 21 | 22 | 23 | 24 | 25 | 26 | 27 | Next > |
Return Interval & Probability Analysis
Bankfull discharge has been observed to recur several times per year for those counting days that the channel is above its banks and flooding. Bankfull Discharge recurrence is often estimated, however, using USGS peak discharge data, which is a record of daily instantaneous peak flows, and restricts recurrence to 1 day per year or less frequently.
Recurrence interval (RI), in years, is often taken as the inverse of exceedance probability (p), where RI = 1/p, and p has a value between 0 and 1. A discharge with a 0.01 probability has a recurrence interval of 100 years.
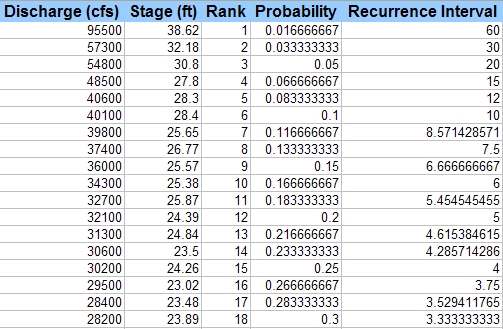
Recurrence probability is computed using various techniques, including the Water Resources Council 1972 method. A simple empirical method to get probability is to use a ranking system of observed peak discharges. In this approach, the observed discharge data (numbering N) are sorted from greatest to least, and then the greatest discharge receives a rank (denoted as m) of 1, the next greatest discharge a rank of 2, and so on until all discharges are ranked. If there were 50 years of data, the highest rank would be 50.
The probability is computed by dividing the rank by the total number of years of data plus 1, p = m / (N + 1), where p, N, and m are defined above. A graph of discharge and recurrence probability or interval can then be constructed.
| < Previous | 1 | 2 | 3 | 4 | 5 | 6 | 7 | 8 | 9 | 10 | 11 | 12 | 13 | 14 | 15 | 16 | 17 | 18 | 19 | 20 | 21 | 22 | 23 | 24 | 25 | 26 | 27 | Next > |