Explanation of Measuring Valley Length & Slope Exercise
Exercise Objective
To assess how Valley length and slope for the South Brush River Reach were measured using topographic maps and aerial photos.
Exercise Explanation
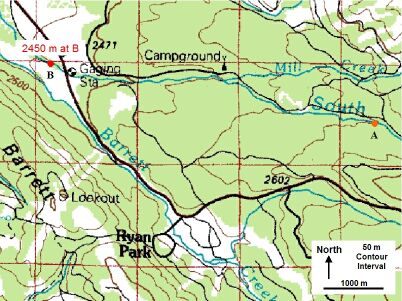
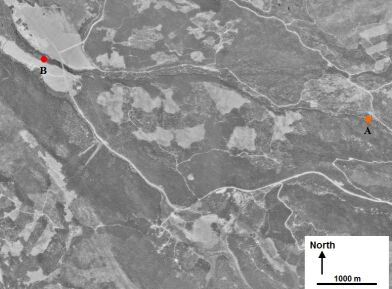
- ImageJ software was used to view the map provided in this exercise, and then set the 1000 m scale for later measurements of Valley features. The scale is approximately 120 pixels for 1000 meters.
- Point B, along the downstream section of the South River, below the USGS Gage, is at an Elevation for B of 2450 m, as stated on the map and determined by the thick Elevation contour of 2500 m upstream of Point B.
- Point A, along the upstream section of the South River, is at an Elevation for A of 2650 m, as determined by counting contour intervals and incrementing 50 m for each interval from Point B.
- The Valley length between South Brush River points A and B is about a distance of 5500 m.
- The Valley slope is computed as the change in Elevation per change in distance, or (2650 m - 2450 m) / (5550 m - 0 m), for a slope of 0.0364 m/m or 3.64%.

Image courtesy of USGS
|
Developed by 