| glossary | menu | Normal | lg | hc | 1.) Fluvial Geomorphology Training Module > Flow Charts, Diagrams, and Tables |
| < Previous | 1 | 2 | 3 | 4 | 5 | 6 | 7 | 8 | 9 | 10 | 11 | 12 | 13 | 14 | 15 | 16 | 17 | 18 | 19 | 20 | 21 | 22 | 23 | 24 | 25 | 26 | 27 | Next > |
Flow Charts, Diagrams, and Tables
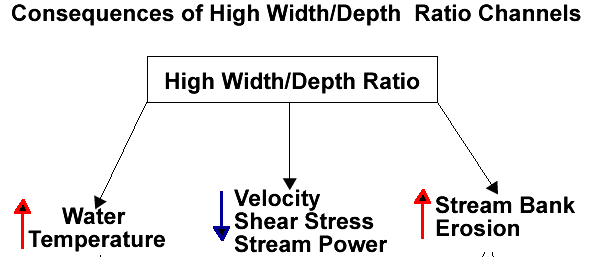
 Flow charts, diagrams, and tables are diagrams that convey information in an organized, often hierarchical, format. In this example, the FGM concept of Width/Depth Ratio is related to water temperature, velocity, Shear Stress, and Stream Bank Erosion.
| < Previous | 1 | 2 | 3 | 4 | 5 | 6 | 7 | 8 | 9 | 10 | 11 | 12 | 13 | 14 | 15 | 16 | 17 | 18 | 19 | 20 | 21 | 22 | 23 | 24 | 25 | 26 | 27 | Next > |